
Attribution Analytics
Marketing Dashboard Metrics: How to Build Executive-Proof Dashboards
Most dashboards fail in exec meetings. Learn how operators define metrics, assign ownership, and maintain QA so leaders can trust the numbers.
Build vendor scorecards that make agencies and 3PLs accountable. This guide covers SLAs, KPI thresholds, scoring formulas, dashboard cadence, and escalation rules.

Vendor scorecards fail when they sit in a spreadsheet that nobody uses until renewal season.
The operator problem is not KPI selection. It is governance. By the time a vendor review turns uncomfortable, your team has already paid the retainer, absorbed the missed launch, eaten the late shipments, or watched acquisition costs climb without a clean record of why.
Picture the review meeting. Your team says the agency missed the launch window. The agency says the brief came late. The 3PL says on-time shipping held above target, but support tickets show customers still waited too long. Then finance asks what the misses cost. Nobody in the room can answer from the same set of numbers.
The scorecard has to do more than report performance. It has to define what the vendor owns, show the evidence, force the review, and trigger a commercial decision. Procurement guidance points in the same direction: a small weighted key performance indicator (KPI) set, shared visibility, and recurring reviews outperform ad hoc check-ins and subjective feedback.12
That matters even more for operator-heavy vendor categories. Email partners should be judged on inbox placement, spam, and missing rates, not just “delivered,” because inbox shortfalls still distort campaign economics at scale.3 Third-party logistics providers (3PLs) should be judged against hard benchmarks for order accuracy, on-time shipping, inventory accuracy, and dock-to-stock time because those misses hit margin, working capital, and customer retention at the same time.4
This article gives you a system for that. The structure is simple:
Do not start with a template. Start with the economic risk.
A good vendor scorecard measures the part of the business that the vendor can change with its own work. If you score an agency on blended revenue when the site is broken, or you score a 3PL on gross sales during a stockout, you do not have accountability. You have noise.
Use one governing outcome per vendor, then add supporting reliability metrics around it.
| Vendor type | Governing outcome | Financial consequence | Core scorecard spine |
|---|---|---|---|
| Creative agency | Launch reliability and approval velocity | Delayed campaigns, slower testing, wasted media spend | On-time milestones, first-draft turnaround, first-pass acceptance |
| Email or lifecycle partner | Deliverability and revenue quality | Lower contribution margin from missed inbox placement | Inbox placement, spam complaints, revenue per thousand delivered |
| 3PL | Fulfillment reliability and inventory control | Refunds, replacement cost, support load, cash tied in bad inventory | Order accuracy, on-time shipping, inventory accuracy, dock-to-stock |
| Paid media agency | Spend efficiency against the declared model | Higher customer acquisition cost (CAC), lower margin, budget waste | Budget adherence, pacing accuracy, CAC or return on ad spend (ROAS) vs. plan |
This is the filter that keeps the scorecard from turning into a procurement worksheet. You are not collecting metrics because software can display them. You are choosing the few signals that protect margin, cash, speed, or service quality.
Once you know the outcome, you can build the operating loop:
SLAs → Scorecards → Dashboards → Reviews → Adjustments → SLAs
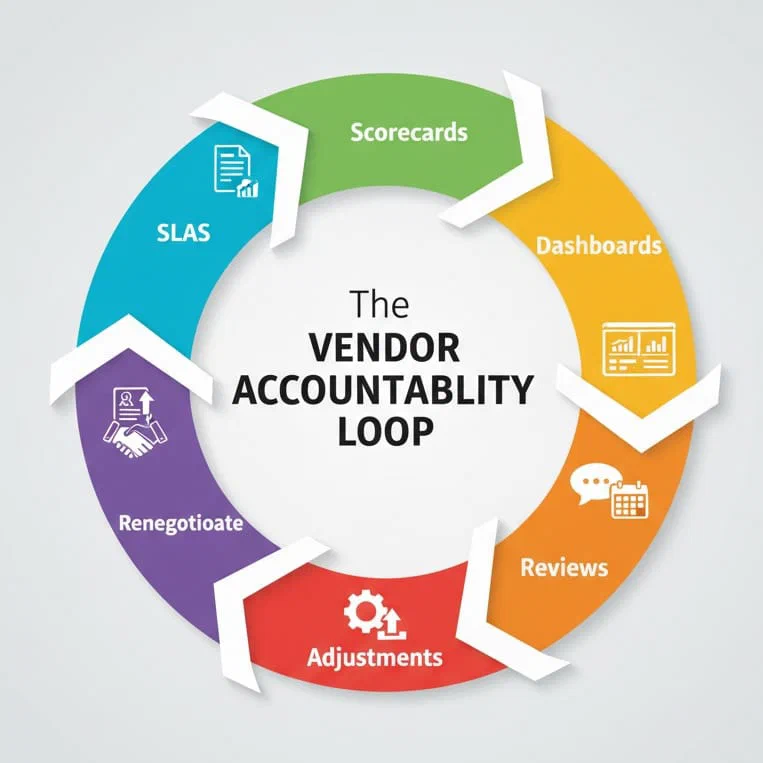
This loop gives the scorecard teeth. The SLA sets the target. The scorecard turns it into a weighted record. The dashboard exposes the result. The review assigns owners and dates. The adjustment step changes money, scope, workflow, or the contract itself. Shared supplier dashboards and recurring reviews matter because they turn performance management into a repeatable system instead of a quarterly argument.56
Most vendor frustration starts when the contract names outputs but never defines proof.
Keep the clause set short. Make each line measurable.
If the contract does not define the evidence source, the review meeting will drift into interpretation. The vendor will cite one dashboard. Your team will cite another. The scorecard will stop being an operating tool and turn into a debate club.
Keep 3–7 KPIs per vendor. That range is enough to capture outcomes and process reliability without creating reporting bloat.9
The goal is not a pretty spreadsheet. The goal is one score that tells an operator whether the relationship is healthy, slipping, or expensive to keep.
Use these formulas in Google Sheets:
=(Actual/Target)*100=(Target/Actual)*100=ROUND(Score * Weight, 1)=IFS(Score>=90,"🟢",Score>=80,"🟡",TRUE,"🔴")=ROUND(Monthly_Fee * Credit_Rate * MAX(0,(Target-Actual)/Target), 2)If you do not want to reward overperformance, cap the metric with =MIN(100, <score_formula>).
| KPI | Target | Actual | Score | Weight | Weighted | Status |
|---|---|---|---|---|---|---|
| On-time milestones | 95% | 97% | 102 | 0.25 | 25.5 | 🟢 |
| First-draft turnaround (days, lower is better) | 3 | 3.4 | 88 | 0.20 | 17.6 | 🟡 |
| Revision rounds | ≤2.0 | 1.6 | 125 | 0.15 | 18.8 | 🟢 |
| First-pass acceptance | 80% | 76% | 95 | 0.20 | 19.0 | 🟡 |
| Stakeholder NPS | 50 | 54 | 108 | 0.20 | 21.6 | 🟢 |
| Total | 1.00 | 102.5 |
Targets should tighten with volume, complexity, and maturity. Email and 3PL rows below track to current benchmark guidance from Validity and Red Stag.10
| Vendor | KPI | Ramp | Steady | Scale |
|---|---|---|---|---|
| Creative | On-time | 92% | 95% | 97% |
| Creative | First-draft days | 4 | 3 | 2 |
| Inbox placement | 85% | 90% | 92%+ | |
| Spam complaints | <0.5% | <0.3% | <0.2% | |
| 3PL | Order accuracy | 99.5% | 99.7% | 99.9% |
| 3PL | Dock-to-stock | 48h | 24h | 24h |
| Paid | Budget adherence | 95–105% | 98–102% | 99–101% |
| Paid | Creative refresh cadence | 14–21d | 7–14d | 7–10d |
The score is still just math until both sides can see the same record.
Tie every KPI to a source of record and set a freshness standard. Supplier-performance playbooks keep returning to the same requirement: shared definitions, clean lineage, and recurring views of trend data.11
| KPI | System of record | Report/table | Fields | Filter | Freshness | Owner |
|---|---|---|---|---|---|---|
| On-time milestones | Project management tool | Milestones | due, completed | current month | weekly | Agency project manager |
| Inbox placement | Deliverability tool | Seed or panel report | inbox, spam, missing | top ISPs | weekly | Email service provider (ESP) |
| Order accuracy | Warehouse management system (WMS) | QA exceptions | total, error | 30-day window | daily | 3PL |
| Budget adherence | Ads manager | Spend summary | budget, spend | channel | daily | Agency |
| Inventory accuracy | WMS | Cycle counts | counted, variance | SKU class | weekly | 3PL |
Build one page that an operator can read in 60 seconds.
Read my article on Dashboard Specs here.
| Panel | Question | Chart | Dimensions | Measures | Filters |
|---|---|---|---|---|---|
| Vendor league table | Who is winning or at risk | Table | vendor | score, 90-day trend, red flags | month |
| Spend vs outcome | Is spend driving results | Combo | vendor, channel | spend, outcome KPI | month |
| Reliability KPIs | Where process is breaking | Heatmap | vendor × KPI | variance to target | month |
| SLA credits | What misses cost | Bar | vendor | credits by month | quarter |
| Risk register | What needs action now | Table | vendor | issue, age, owner | open only |
Once the dashboard is shared, the relationship changes. You stop arguing about what happened and start working on what to do next.
Hold the review monthly until variance stabilizes. Shift stable vendors to quarterly only after the operating rhythm is clean.12
Keep one accountable owner on your side of the table.
| Activity | Ops | Channel owner | Finance | Vendor |
|---|---|---|---|---|
| Data pull and quality assurance (QA) | R | C | I | C |
| Scorecard build | R | C | I | C |
| Review meeting | A | R | C | R |
| Corrective action plan | A | R | C | R |
| Contract adjustments | C | C | A | I |
This is the section most teams skip. It is also the whole point.
If the score does not change compensation, scope, approval rights, or tenure, the vendor will treat it as commentary. You want the scorecard to alter the commercial relationship.
Use the score to make decisions:
Structured evaluations surface savings and create a cleaner operating relationship because both sides know what happens when performance rises or falls.13
Translate the metric change into dollars before you prioritize the fix.
Once you run the math, the meeting changes. The team stops arguing about whether a metric matters and starts deciding which miss is worth fixing first.
Do not wait for the next renewal cycle. Build the scorecard into the operating model now.
Pick the governing outcome for each vendor, define 3–7 KPIs, sign the SLA language, publish the dashboard shell, and schedule the first review.
Automate data pulls, clean the evidence definitions, apply credits for misses, and remove any KPI that nobody can prove cleanly.
Add the vendor league table to the exec deck and start using the score to make expansion, pricing, and re-bid decisions.
Every new vendor should enter the system the same way:
The system is live at that point. Then the real management work starts: diagnosing misses fast, fixing the right process, and replacing partners when the pattern stays red.
A red score is not a verdict. It is a routing signal.
Your scorecard should also govern vendor selection and replacement.
| Criterion | Weight | Scoring notes |
|---|---|---|
| Proof of KPIs with platform evidence | 30 | Prior dashboards, raw exports |
| Outcome alignment | 25 | CAC, marketing efficiency ratio (MER), accuracy, inbox |
| Process reliability | 20 | On-time delivery, incident SLAs |
| Transparency | 15 | Read access, audit logs |
| Experimentation | 10 | Velocity and results |
One DTC brand ran this system across four partners: a creative agency, an email service provider (ESP), a 3PL, and a paid media agency.
The weak spots were clear in the first month. The 3PL sat at 99.5% order accuracy and 95% on-time shipping. The ESP partner held inbox placement at 86% with spam complaints at 0.35%. The paid media agency was pacing at roughly ±6% against budget.
The operator changed three things. The team locked a 24-hour dock-to-stock SLA with credits, added inbox placement from provider panels to the email scorecard, and enforced a 98–102% budget adherence rule with weekly pacing calls.
Ninety days later, the 3PL reached 99.8% accuracy and 97% on-time shipping. Inbox placement rose to 91% and spam complaints fell to 0.18%. Budget adherence tightened to ±1.5%. Credits fell to zero. The brand expanded two vendor relationships tied to scores above 95 and replaced one partner that stayed below threshold.
The point is not that every vendor became perfect. The point is that the team stopped managing vendors through memory, frustration, and anecdote.
Start with one vendor, not all of them.
Pick the partner that creates the most margin risk right now. Write one governing outcome. Define 3–5 KPIs. Put the evidence source next to each one. Schedule the review meeting before you finish the sheet. Then decide in advance what happens at 95, 90, 80, and below.
Then repeat the review every month until the conversation gets boring. That is the point. Once the team can see the same numbers, name the same miss, and trigger the same consequence, the scorecard stops being a dashboard project. It becomes part of how you run the business.

A complete Excel scorecard system: KPI library, benchmarks, weighted scoring, SLA clause bank, dashboard spec, and rollout plan.
No spam. Unsubscribe anytime.
https://www.highradius.com/resources/Blog/supplier-scorecard/ ↩︎
https://cporising.com/2025/08/06/state-of-supplier-management-2025-part-3-optimizing-supplier-performance-management-for-strategic-impact/ ↩︎
https://www.validity.com/wp-content/uploads/2025/03/2025-Benchmark-Report-FINAL.pdf ↩︎
https://redstagfulfillment.com/how-to-manage-3pl-performance/ ↩︎
https://cporising.com/2025/08/06/state-of-supplier-management-2025-part-3-optimizing-supplier-performance-management-for-strategic-impact/ ↩︎
https://www.validity.com/wp-content/uploads/2025/03/2025-Benchmark-Report-FINAL.pdf ↩︎
https://redstagfulfillment.com/how-to-manage-3pl-performance/ ↩︎
https://precoro.com/blog/vendor-scorecard-definition-benefits-examples-free-template/ ↩︎
https://www.validity.com/wp-content/uploads/2025/03/2025-Benchmark-Report-FINAL.pdf ↩︎
https://www.kodiakhub.com/blog/supplier-performance-management-process-templates-cadence ↩︎
https://www.highradius.com/resources/Blog/supplier-scorecard/ ↩︎
https://redstagfulfillment.com/how-to-manage-3pl-performance/ ↩︎
https://www.validity.com/wp-content/uploads/2025/03/2025-Benchmark-Report-FINAL.pdf ↩︎
https://redstagfulfillment.com/how-to-manage-3pl-performance/ ↩︎

Frequently Asked Questions
A vendor scorecard is a small weighted set of KPIs that measures vendor performance on a fixed cadence. It gives you one operating view of whether the relationship is helping or hurting the business.
Three to seven. That is enough to capture outcomes and reliability without turning the review into data theater.
Creative or email agency: on-time delivery, turnaround time, revision rounds, inbox placement, complaint rate, and revenue per thousand delivered. Paid media agency: budget adherence, pacing accuracy, CAC or ROAS versus plan, valid traffic rate, and creative refresh cadence. 3PL: order accuracy, on-time shipping, inventory accuracy, dock-to-stock time, and cost per unit shipped.
Monthly until variance stabilizes, then quarterly for stable vendors. Keep the agenda tight and attach owners and dates to every miss.
Start with public benchmarks where they exist, then tighten the target as the relationship matures. The easiest pattern is a ramp, steady, and scale tier.
Assign each KPI a weight based on business impact, calculate a 0–100 score for the metric, multiply by the weight, and sum the result to one total score. Keep the total weight at 1.00.
Scope, KPIs with numeric targets, evidence source, sampling frequency, audit rights, incident response thresholds, cure periods, credits, termination language, and security requirements.
Continue Reading