
Analytics Setup
GA4 Content Grouping Setup: Structuring Analytics for the Media-to-Cart Loop
How to configure GA4 content grouping to segment analytics by business function rather than URL structure.
Most dashboards fail in exec meetings. Learn how operators define metrics, assign ownership, and maintain QA so leaders can trust the numbers.

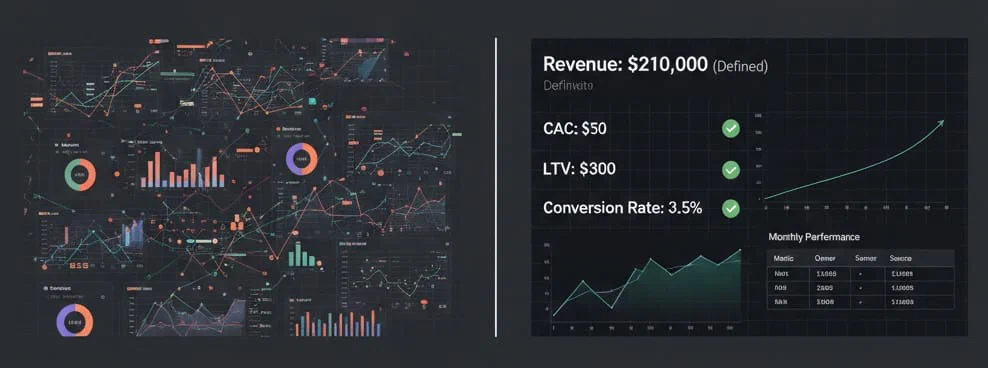
The slide goes up in the Monday executive meeting.
Two numbers are displayed side-by-side. Both are labeled Revenue.
The Director of Marketing swears the number is $240,000, pointing to the platform attribution dashboard. The VP of Finance swears the number is $180,000, pointing directly to the cash-in-bank settlement reports. Everyone in the room immediately stops looking at the trends and starts looking for someone to blame.
The meeting stalls, the strategic story behind the numbers gets entirely lost, and someone inevitably mutters, “We need one source of truth.”
This scenario isn’t just an annoyance — it’s an operational failure that actively destroys profitability. When a leadership team cannot agree on basic unit economics, capital deployment freezes. Marketing cannot confidently scale ad spend, operations cannot reliably forecast inventory, and finance defaults to defensive budget cuts. The cost of data chaos is measurable in gross margin decay.
Your business intelligence (BI) tool rarely causes the failure. Teams fail when they launch charts before they agree on what the numbers mean. They treat dashboarding as a software decision instead of a governance decision.
The fix is a Dashboard Specification. This shared document defines what you measure, how you calculate it, which system supplies the source data, and who owns the result. If your executive team needs a rule for trustworthy reporting, use this one: define the metric before you build the dashboard.
By the end of this guide, you will know how to write the spec, govern it across departments, translate it into your BI layer, and keep it accurate once the business changes.
If you only take one action from this article, take this one. Pick the 10 to 15 numbers that run the business, define them in writing, assign an owner to each one, and require every dashboard to inherit those definitions.
That sequence matters. Teams that start with charts inherit every disagreement hiding in Meta, Shopify, GA4, and finance exports. Teams that start with a spec force those disagreements into the open, settle them once, and then let the dashboard display the approved math.
For an operator, that changes the job of reporting. The dashboard stops serving as a debate starter and starts serving as a capital allocation tool.
To understand why a dashboard spec is non-negotiable for scale, we have to look at how data breaks down in modern direct-to-consumer (DTC) and digital media operations.
Revenue, CAC (customer acquisition cost), and LTV (lifetime value) are not objective laws of physics. They are arguments until you define them explicitly.
One system treats revenue as gross sales with shipping, taxes, and discounts included. Another reports net revenue after refunds and cost of goods sold (COGS). Marketing may calculate CAC from ad spend and platform-attributed conversions. Finance may calculate it from total departmental spend, including agency fees and software, against new customers in the customer relationship management system (CRM).
No one is inherently wrong; they are simply speaking different data dialects. But when those dialects collide in an executive meeting, the resulting confusion slows down decision-making. If you are a $20M business trying to scale to $50M, a 15% discrepancy in CAC calculation can mean the difference between aggressively capturing market share and accidentally scaling your way into unprofitability.
Your technology stack includes Google Analytics 4 (GA4), Shopify, Klaviyo, Meta Ads, and TikTok. Each system uses its own dates, attribution rules, and conversion logic.
Meta will claim a purchase occurred because someone viewed an ad seven days ago and eventually bought under 7-day click and 1-day view attribution. Shopify will claim that same purchase belongs to organic search because the customer Googled your brand name right before checking out. If you simply aggregate the “purchases” reported by each platform into a single dashboard without a reconciliation layer, you will easily report 140% of your actual sales.
Dashboards age aggressively. A beautifully designed Looker Studio report launched in Q1 will be obsolete by Q3 if no one owns the QA process. Traffic sources change, UTM parameters break, and new product lines are introduced. If there is no documented governance system dictating how updates are managed, the “real numbers” decay into corporate folklore.
The financial cost of this chaos is steep. Research indicates that only a fraction of dashboards are used consistently after their initial launch, usually due to broken trust.1 In contrast, well-governed automated dashboards routinely slash weekly reporting preparation time by up to 80%, freeing up operators to actually analyze the market rather than just compile spreadsheets.2
To see this play out, consider the classic DTC blind spot: scaling paid media on platform data instead of blended economics.
The Setup: On Tuesday, Marketing reviews the Meta Ads dashboard. The platform claims a $45 CAC against a $100 Average Order Value (AOV). Seeing profitable unit economics, the Marketing Director authorizes a 20% budget increase for the weekend.
The Reality: On Monday, Finance pulls the Shopify gross margin report. Total media spend divided by total new customers acquired yields a true blended CAC of $85. Once COGS, shipping, and fulfillment are factored in, the brand actively lost $5 per order scaling that weekend.
Why did this happen?
Without a documented spec dictating that the executive dashboard uses Blended CAC — and strictly defining what constitutes a “net-new customer” — Marketing will keep burning cash based on platform-specific illusions, while Finance pulls the emergency brake.
A Dashboard Spec is the operating document behind your reporting. Before anyone builds a chart, the team should draft it, debate it, and sign off on it. The spec removes ambiguity because it defines the math in plain terms.
A robust spec requires seven columns for every single metric:
| Field | Purpose | Operator Example |
|---|---|---|
| Metric Name | The exact, finalized title of the KPI. | Blended First-Purchase CAC |
| Definition | A plain-language explanation of what it means. | Total marketing expenditure divided by the number of net-new customers acquired. |
| Formula | The exact mathematical calculation. | (Meta Spend + Google Spend + Agency Fees) ÷ (Shopify Customers where Orders = 1) |
| Data Source(s) | Where the raw data originates. | Spend from GA4/Platform APIs; Orders from Shopify via Fivetran. |
| Owner | The specific person accountable for the data’s integrity. | Sarah J. (Head of Growth) |
| Update Cadence | How often the data refreshes and is verified. | Automated daily; manual QA weekly. |
| Exclusions & Edge Cases | The nuance that causes arguments. | Exclude influencer barter orders (discount code 100%) and wholesale B2B accounts. |
A dashboard without a spec gives disagreement a prettier interface. The spec forces teams to surface assumptions they would rather leave implicit. Many teams need several weeks to lock the first version because finance, marketing, and operations are finally arguing about the same calculation.
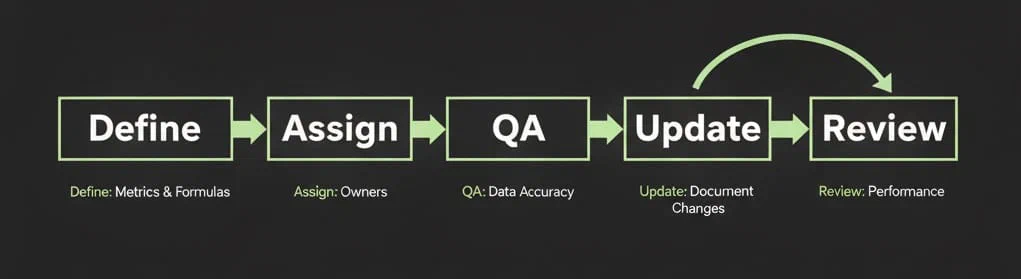
Implementing a dashboard spec is not a technical project; it is a change-management project. It requires cross-functional alignment and a willingness to abandon pet metrics. Here is the exact system operators use to build executive-proof reporting.
You cannot build a new source of truth without understanding the old ones:
Start small. Do not try to define 50 metrics at once. Choose the top 10 KPIs that drive the business — usually variations of Revenue, Margin, CAC, LTV, and Conversion Rate.
Bring the VP of Finance, the Director of Marketing, and your data lead into a 60-minute alignment session. The goal of this meeting is not to look at charts; it is to define the math. When Marketing asks to measure “ROAS” (Return on Ad Spend), Finance must enforce whether that is platform ROAS or blended MER (Marketing Efficiency Ratio). Lock these finalized formulas into the spec document.
At one $30M DTC brand, an audit revealed five different versions of “CAC” scattered across departmental reports. Consolidating to a single, spec-backed definition took one meeting, but it shaved twelve hours off their weekly reporting cycle and exposed a massive over-allocation in top-of-funnel video spend.
One metric, one owner. “The Marketing Team” cannot own a metric. Shared accountability is no accountability.
Ownership does not mean this person controls the number; it means they are responsible for its integrity. If the API breaks and the data goes flat, the owner is the one who flags it. Document the owner’s name in the spec alongside their required QA cadence.
A spec is only useful if it reflects reality. As the business evolves, formulas will need to change. Perhaps you add a new retail channel, or a new ad platform natively changes its attribution window.
You must create a change management protocol:
After the team agrees on definitions, you need an implementation path that fits your operating model. A $5M brand running on spreadsheets and native dashboards will roll this out differently than a $40M business with a warehouse, dbt, and an analyst team. But the rule does not change: the spec defines the logic, and the tooling only decides where you encode it.
Human alignment is the hardest part of data governance. Once the definitions are locked and the ownership is assigned, the technical implementation becomes more mechanical. You must push your approved spec into your actual tooling, whether that means Looker Studio, Power BI, Triple Whale, SQL models, or a finance-owned spreadsheet that reconciles platform data before it reaches leadership.
The translation process usually follows this flow:
customer_tag = 'wholesale'.By separating the logic from the presentation, you preserve the business rules even when the reporting layer changes. If you replace Looker Studio next quarter, you should only swap the display layer, not renegotiate CAC.
Building the dashboard is step one. Defending its integrity takes operational discipline.
When the inevitable happens and a department brings a contradictory spreadsheet to a meeting, the escalation rule must be absolute: The Spec Wins.
If the spreadsheet highlights a genuine flaw in the dashboard’s logic, the team does not abandon the dashboard. Instead, they update the spec, fix the data pipeline, and re-deploy the dashboard. You must ruthlessly protect the single source of truth, or the organization will fracture back into data silos.
One practical example: a brand adds a wholesale channel in Q3, but the dashboard still counts those orders as ecommerce revenue. Finance catches the variance during month-end close. If the team has a spec, the fix is clean. The owner updates the revenue definition, the analyst changes the exclusion logic, and leadership gets a revised number with a documented reason. Without the spec, the same issue produces three spreadsheets, four explanations, and another week of distrust.
Keep your executive views lean. Do not cram 40 metrics onto one screen. Limit the main dashboard to the 10 to 15 KPIs defined in your alignment session. Use conditional formatting to highlight changes against the forecast rather than just displaying vanity totals. A dashboard should tell you exactly what exploded, what worked, and where to look next without requiring a magnifying glass.
This level of rigor can feel heavy if your team is used to piping GA4 into a dashboard and moving on. Executives do not need more charts. They need a reporting system that tells them where to spend, where to cut, and when to trust the trend line in front of them.
Executives do not fund teams that cannot agree on yesterday’s revenue. Marketing does not win more budget with prettier charts. It wins more budget with reliable, audited math that shows where each dollar produces a return.
When your metrics rest on a governed spec, the company spends less time reconciling reports and more time making decisions. You can deploy capital with more confidence because your CAC is real, your margins are accurate, and your reporting logic holds up under scrutiny.
Another deep dive on tracking mechanics: GA4 Content Grouping Setup: Structuring Analytics for the Media-to-Cart Loop
Do not wait for a warehouse rebuild or a dashboard redesign. Start with one working session and one document.
This week, do three things:
If the room cannot agree on the math, you found the real reporting problem. Fix that first. The dashboard can wait a few days.

Frequently Asked Questions
A dashboard visualizes data. The spec defines it. The first is presentation; the second is governance.
Quarterly minimum. High-volume metrics (like CAC or ROAS) should be checked weekly.
Revenue, CAC, LTV, Retention, Exceptions, Conversion Rate, and Email Revenue Share, metrics that tie directly to growth, not just reach.
Agree on definitions first, then automate the math. The spec is your peace treaty.
Bake QA into job expectations. Ownership without accountability is just decoration.
Continue Reading