
Attribution Analytics
Marketing Dashboard Metrics: How to Build Executive-Proof Dashboards
Most dashboards fail in exec meetings. Learn how operators define metrics, assign ownership, and maintain QA so leaders can trust the numbers.
A step-by-step Shopify BFCM guide for DTC operators. Learn how to plan your Black Friday sale, manage offers, creative assets, and inventory, and run post-sale reviews that drive smarter, more profitable campaigns year-round.
Black Friday–Cyber Monday (BFCM) isn’t a holiday for promotions — it’s an operational stress test. Your Shopify store will be running at maximum capacity for one weekend. Inadequate management of your inventory, poorly developed discounting logic, and ambiguous assumptions about your third-party logistics provider (3PL) begin to eat into profit.
In 2024, consumers in the United States reportedly spent approximately $10.8 billion online on Black Friday, representing a 10 percent year-over-year increase in spending.1 During that same time frame, Shopify merchants reported processing approximately $4.1 billion in total sales within a 24 hour window, a 22 percent increase over the previous year.2 DTC brands were responsible for over $2 billion in total sales across the BFCM weekend.3
While social media fills with reports of record-breaking gross sales, numerous operators are left questioning their profitability once advertising expenses, increased shipping fees, and January returns are reconciled. This playbook attempts to address that gap.
The primary audience is DTC operators who evaluate success based upon metrics such as profit margins, service level agreement (SLA) compliance, and delivery lead times — rather than likes, clicks, or views.
If there is one item that should be taken away from reading this playbook, it is this: manage BFCM as a controlled operating system, not as a single marketing campaign.
The financial team establishes margin limits. The marketing team creates promotions within those margin limits. The operational team develops the warehouse and shipping plan before demand arrives. The support team develops contingency plans before customers experience problems.
When one function outpaces another function, BFCM may become a cash flow issue.
This playbook follows that format. First, we establish the financial parameters. Next, we describe the resources and automated processes used to operate within those constraints. Afterward, we discuss how to manage the weekend using the structure of a command center. Lastly, we turn what the weekend taught us into next year’s process.
Imagine a wellness brand that generates annual revenues of $15 million, which entered last year’s BFCM with only one objective: “Generate $1 Million in Weekend Revenue.” To achieve that goal, they ran a flat 30% sitewide discount to increase conversion rates.
Marketing celebrated on Cyber Monday. Gross sales exceeded $1.2 million. However, it wasn’t until January that the company saw the true nature of their operational situation.
The Net Result? The company earned $1.2 million in revenue and realized only a 9% net margin — barely enough to cover fixed costs and a serious squeeze on Q1 working capital.
Gross sales do not matter during BFCM. Only net profitability matters.
Protecting against this type of margin destruction does not come from better ad copy; it comes from strict operational architecture built months in advance. The four-phase protocol outlined below is intended to keep your systems intact, ensure your staff work together effectively, and protect your margins from September forecasting through December reconciliation.
Operator Principle: Plan like finance; execute like marketing.
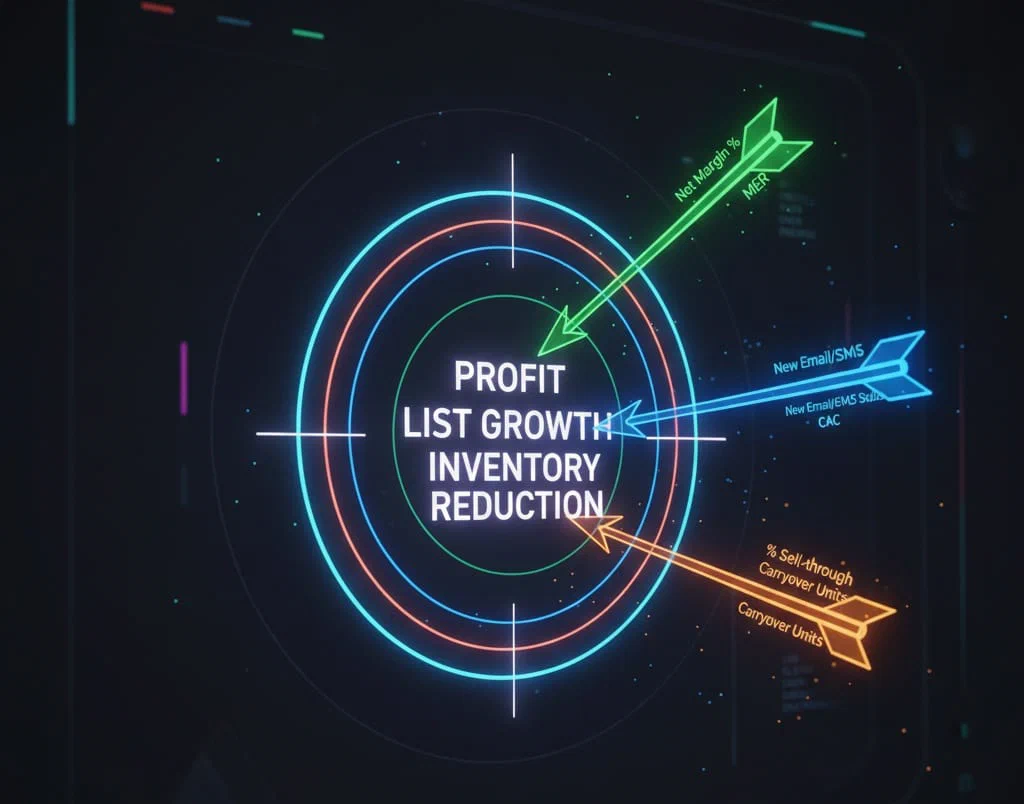
You cannot be successful during BFCM unless your success criteria are aligned across your departments. Probably one of the largest reasons companies fail with their BFCM strategy is that marketing optimizes for top-line revenue, finance optimizes for margins, and operations optimizes for throughput. Choose a single primary organizational objective and get every department to set its goals against it.
This is not a report generation activity. It is a capital allocation decision. If your organization says it wants margin but keeps paying bonuses on top-line screenshots, your entire plan will drift toward unprofitable volume.
| Objective | Primary KPI | Secondary KPI | Example Target |
|---|---|---|---|
| Profitability | Net Margin % | Marketing efficiency ratio (MER) | ≥ 25% net margin, MER > 3.0 |
| List Growth | New Email/SMS Subs | Customer acquisition cost (CAC) | +30% list growth, CAC < lifetime value (LTV)/3 |
| Inventory Clearance | % Sell-through | Carryover Units | 90%+ clearance on seasonal SKUs |
MER = Total Revenue ÷ Total Ad Spend. Monitor MER hourly throughout the peak BFCM window. If MER falls below 2.5, either your promotion isn’t resonating with your target audience or your creative is leaking traffic — take action before you burn advertising dollars. DTC founders are moving hard from “record revenue” to profit-first planning.4
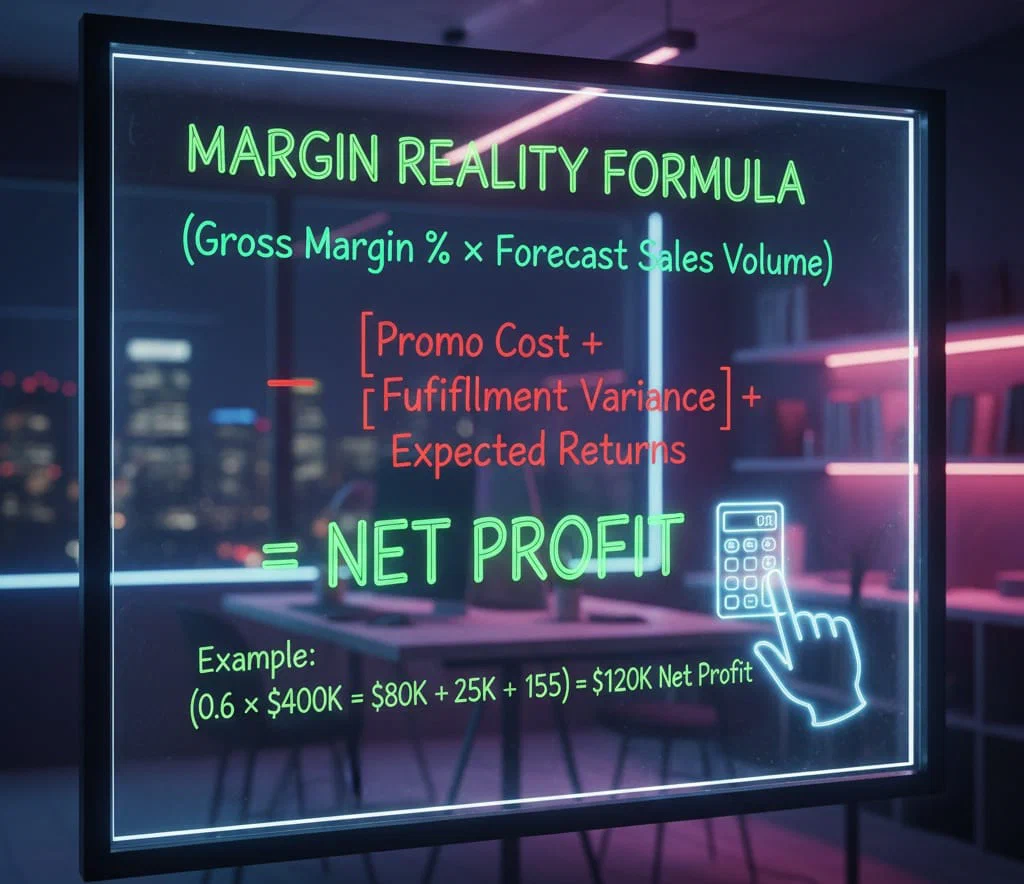
Your discount is not a marketing technique. It is a cost line. Design your discount without accounting for operational realities and you will give away margin before the weekend begins. Run this formula before locking in your offer:
(Gross Margin % × Forecast Sales Volume)
– (Promo Cost + Fulfillment Variance + Expected Returns)
= Projected Gross Profit
Pull your inputs from these sources:
Discount % × Forecast Revenue. Basic math.Example Calculation: If you forecast $400,000 in sales at a baseline gross margin of 60% and offer 20% off:
Calculation: (0.60 × $400,000) – ($80,000 + $25,000 + $15,000) = $120,000 net profit — a 30% net margin.
Finance Shortcut: If your Promo Cost + 3PL Variance exceeds 50% of your gross baseline profit, your “sale” is killing you. Restructure the offer immediately.
A single sitewide discount trains your most loyal customers to devalue your brand. Nine specific combinations let you monetize each cohort effectively — without leaving money behind.
| Segment | Primary Offer | Backup Offer | VIP Angle |
|---|---|---|---|
| New Customers | Sitewide 20% off | Free Shipping + Baseline Gift | “First-Time Buyer Early Access” |
| Returning Customers | Tiered Spend (15/20/25%) | Loyalty Point Multiplier | “Member-Only Bonus Gift” |
| Lapsed Customers | “Win-Back Bundle” | Free Gift on Any Order | “We Miss You + 20% Off” |
Average discount depth across the ecosystem hit 19% on Black Friday vs 9% pre-BFCM.5 This gives you a basis for setting your own discount range.
Governing the Marketing Department: This is where governance of the marketing function intersects with creative resistance. Marketing will likely assert that a 3×3 grid is overly complex to communicate in ads, or that sitewide 30% produces higher click-through rates (CTRs).
As the operator, you need to stand firm. Show your marketing lead the Margin Reality Formula and insist that the 3×3 Promo Grid is a financial constraint, not a creative suggestion. Create the discount codes in Shopify Discounts ahead of time, label them explicitly by segment — for example BFCM_RETURNING_TIER2 — and sync those exact codes with your Klaviyo flows, so marketing is forced to operate inside the boundaries.
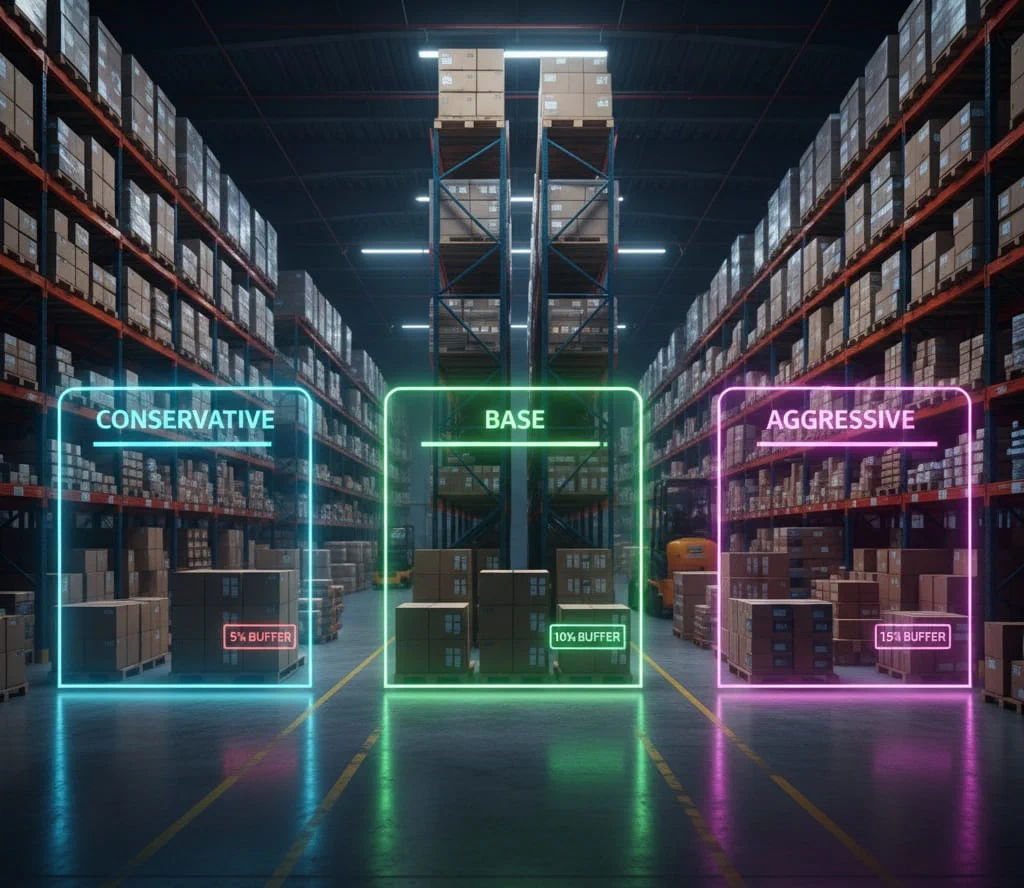
Inventory represents working capital tied up in a warehouse. An operator cannot afford to run out of hero products at peak demand, nor to carry unsold inventory into Q1. Build out Conservative, Base, and Aggressive demand scenarios so cash flow stays protected.
This is where seasonality turns into a balance-sheet exercise. Every extra unit you purchase ties up cash before BFCM starts; every stockout wastes the most efficient demand window of your year.
| Scenario | Sales Volume | Units Needed | Buffer |
|---|---|---|---|
| Conservative | –20% vs LY | 80% of LY units | 5% |
| Base | Equal to LY | 100% | 10% |
| Aggressive | +30% vs LY | 130% of LY units | 15% |
The 3PL Reconciliation Deadline: By October 15, you must systematically reconcile the stock in Shopify with your 3PL’s warehouse management system (WMS). Ghost inventory and missing real-time visibility turn rapidly into backorders and angry customer service tickets.6
Operations Preparation Checklist:
If marketing successfully promotes your sale, support volume will spike. Prepare the safety nets:
60% of consumers start shopping before Thanksgiving;7 42% start before November.8 If you’re still preparing in late October, you’re already behind schedule.
| Timeline Focus | Operational Objective |
|---|---|
| Sep 1–7 | Complete the Margin Reality Formula & finalize purchase orders (POs) for inventory |
| Sep 8–30 | Finalize the 3×3 Promo Grid; provide creative briefs to the design team |
| Oct 1–20 | QA all assets; pre-build Shopify flows and schedule Launchpad |
| Nov 1–10 | Warm-up emails + VIP early-access drops |
| Nov 25 (BFCM) | Control-room execution + live MER monitoring |
Key concept: Sales happen because of systems. Creative teams just decorate them.
The first phase outlined the financial guidelines. In this second phase you produce the marketing assets and build the automated schedule the team will run on — so nobody is improvising under stress.
A normal five-day sale cycle creates a large number of new assets. Without a plan built in advance, assets fail in predictable ways: links rot, coupon codes misfire, and people burn out before the sale reaches full volume.
| Channel | Volume Target | Objective / Cadence |
|---|---|---|
| 8–10 deployments | Warm-up (2), launch (3), reminder (3), final-hours scarcity (2) | |
| SMS | 4–6 deployments | VIP early access, live launch, abandoned-cart reminders |
| Meta ads | 10–12 unique variants | Cold outreach, retargeting, UGC social proof, high-converting carousels |
| Google PMax | 3 asset groups | Product-specific, sale/promo logic, brand defense |
| Organic social | 10–15 touches | Stories, warehouse packing, behind-the-scenes, customer reviews |
The creative brief mandate: Every marketing asset must trace back to a creative brief that states the objective, target segment, discount code, format dimensions, individual owner, and hard deadline. Spending one hour on a well-defined creative brief saves five hours of frantic Slack revisions in the days leading up to Black Friday/Cyber Monday.
Do not rely on human memory to enable and disable discounts.
Remember: 79 percent of BFCM traffic comes from a mobile device. If it works on desktop but fails on iOS, you lose.9
Look beyond standard paid media to diversify acquisition costs.
There is no better way to be unprepared than to wait until the BFCM weekend to create a strategy. This is the moment when you execute your plan (or lack thereof), review the metrics from your execution, and move quickly to adjust the parts of your plan which are broken. This represents the difference between preparation and running a live event. The team had been developing the system for weeks and months; now the system must perform under pressure without its leader constantly intervening in every decision.
There must be a single dashboard accessible to all department heads. Stop refreshing the Shopify total revenue counter — it does not tell you whether you made money or broke a system. Monitor these performance metrics throughout the execution phase, each with a designated owner and an alert threshold:
| Operator Metric | Source | Review Frequency | Critical Alert Threshold |
|---|---|---|---|
| MER | Meta Spend + Shopify Rev | Hourly | Dips below 2.5 |
| Average order value (AOV) | Shopify | Hourly | –10% vs forecast model |
| Fulfillment Lag | 3PL WMS / ShipStation | 2× daily | Orders unfulfilled > 48 hr |
| Customer service (CS) volume | Gorgias / Zendesk | Daily | > 2× baseline expectation |
Use Zapier to configure these Slack alerts. If MER declines, your marketing lead receives instant notifications to stop running bad ad sets; if fulfillment lag spikes, your ops team can approve 3PL overtime right away. Since Black Friday accounts for only 4.1% of total holiday ecommerce revenue, it doesn’t take much for system failures or inefficient ads to compound.10
Learn more: creating executive-ready marketing dashboard metrics
Slack noise during peak periods causes redundant work and slows incident response. Manage the communication environment:
#bfcm-ops-live Slack channel for the BFCM weekend where only department heads can post. Everyone else is read-only.#bfcm-ops-live channel. The problem with hidden DMs is that two people can end up correcting the same error at the same time while damaging a third system.Set a fixed cadence to kill the constant “what’s going on?” pings:
Operator shortcut: Document every incident, mistake, and damaged system in one shared Google Sheet titled “Next Year’s Fix List.” Don’t wait until January to try to remember what went wrong.
The sale isn’t finished when the discount campaigns end; it’s finished when the teams reconcile the data and revise the processes.
This last phase is important because BFCM is supposed to generate future competence, not simply meet this year’s revenue target. If the team closes the book on the weekend without looking back at how things went, they retain the profits BFCM generated but discard the lessons learned.
By mid-December, pull the real numbers from Shopify Analytics and QuickBooks and hold them against the Margin Reality Formula you developed in Phase 1.
| Post-Mortem Metric | Success Baseline |
|---|---|
| Actual MER vs. Forecast | Within ± 0.2 variance |
| Final Net Margin % | ≥ 25% (or target goal) |
| Avg. Fulfillment Delay | ≤ 48 hours for 90% of orders |
| Return & Refund Rate | Held under 4% |
| Email/SMS Unsubscribe Rate | Spiked less than 1% |
A large revenue number alongside a 7% return rate and a 12% net margin is a failure of operational planning.
Do not allow the pain of the weekend to go to waste. All department leaders are required to attend a post-mortem analysis before December 15th.
Managing friction in the post-mortem: Your managers just survived a five-day peak, so they will enter the session defensively. State the rules before you begin: we are going to analyze the process — not attack the person who ran it. If a large wave of orders caused fulfillment delays, then it is probably the SLA forecast model that broke — not the warehouse manager.
Build a shared Notion matrix that categorizes everything into: what worked / what broke (systemic level) / what was redundant / what needs to change next year.
Define specific owners and deadlines for each corrective action as part of your Q1 ops calendar and your Q3 Inventory Planner. Memory fades very quickly — document the new processes while the friction is still present.
Organizations that get less hectic with every BFCM have one major difference: they use the post-mortem as their first planning meeting for the next cycle. Fixes get assigned as owners, deadlines, budget assumptions, and SLA revisions while the evidence is still valid enough to trust.
Do not wait until September to find out whether your BFCM plan was legitimate. Complete these three tasks now:
If your team cannot complete those three tasks in one working session, then you have a promotion plan — not a playbook.
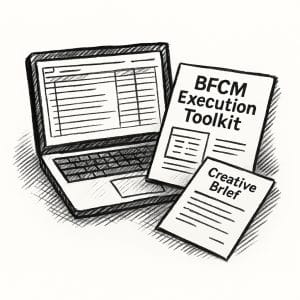
Get the exact checklist and creative brief template that turn chaos into control — built for Shopify DTC operators.
No spam. Unsubscribe anytime.
https://news.shopify.com/shopify-merchants-break-records-black-friday-2024 ↩︎
https://www.modernretail.co/marketing/dtc-briefing-how-startups-are-factoring-profit-into-their-black-friday-calculus ↩︎
https://www.finaloop.com/blog/why-this-2024-bfcm-is-a-lesson-in-inventory-cash-flow-and-financial-data ↩︎
https://business.adobe.com/resources/holiday-shopping-report.html ↩︎
https://forgedigitalmarketing.com/how-dtc-brands-prepare-for-black-friday-and-cyber-monday ↩︎
https://redstagfulfillment.com/ecommerce-sales-percentage-on-black-friday ↩︎

The Engine
Every framework on this site runs inside the DTC Revenue Intelligence Engine — custom AI agents monitoring your key performance areas daily, operator review weekly. If that's what your brand is missing, start with a fit check.
Frequently Asked Questions
By early September. Creative and inventory workflows require backward planning of 8–10 weeks before launch to ensure 3PL and supplier alignment.
Between 3.0 and 4.0 for most $2M–$50M direct-to-consumer brands. Anything under 2.5 during peak velocity requires immediate diagnostic attention to the offer or creative.
8–10 minimum over the 5-day period: 2 warm-ups, 3 launch, 3 reminders, and 2 final hours, tightly segmented to protect deliverability.
Continue Reading