

The slide goes up.
Two numbers.
Both labeled Revenue.
Marketing swears it’s $240,000.
Finance swears it’s $180,000.
Everyone swears at each other.
The meeting stalls, the story behind the numbers gets lost, and someone mutters, “We need one source of truth.”
That’s what this is about.
Dashboards don’t die because of bad data tools. They die because no one agrees what the numbers mean. The fix is simple: a Dashboard Specification—a shared, living document that defines what’s measured, how it’s calculated, and who owns it.
By the end of this article, you’ll know how to write one, govern it, and stop your dashboards from turning into performance art.
Table of contents
Why Dashboards Fail
Undefined Metrics
Revenue, CAC, LTV—these aren’t metrics, they’re arguments until you define them. In one system, “revenue” includes discounts; in another, it doesn’t. No one is wrong; they’re just speaking different data dialects.
Disconnected Sources
GA4, Shopify, Klaviyo, Meta Ads—they’re each a tiny, self-righteous kingdom. None agree on dates, attribution models, or what counts as a conversion.
No Governance
Dashboards age fast. If no one owns QA or updates, the “real numbers” decay into folklore.
The cost of this chaos is measurable. In one study, only 28% of dashboards were used at least once after launch.1 Another analysis found that automated dashboards—when well-governed—cut reporting time by up to 80%.2
The Dashboard Spec: One Document, Zero Debates
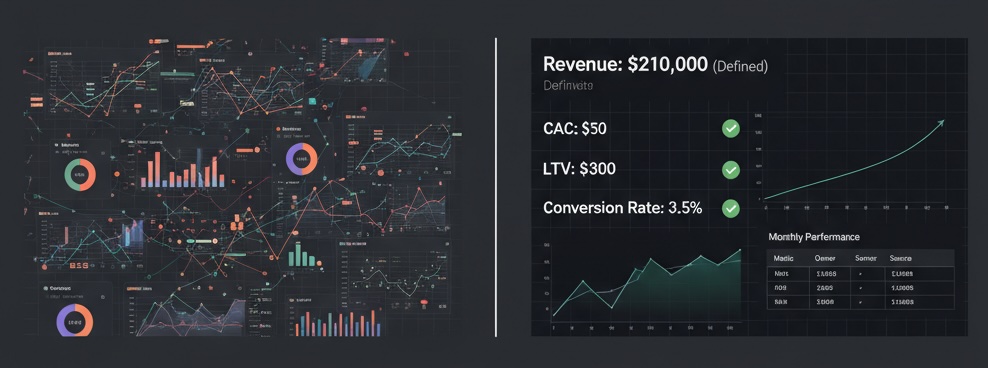
A Dashboard Spec is the dictionary behind your dashboards. It defines every metric in plain language, shows how it’s calculated, identifies its data source, and names who’s accountable.
| Field | Description | Example |
|---|---|---|
| Metric | The KPI being tracked | Customer Acquisition Cost |
| Definition | Clear, standardized meaning | Total paid media spend ÷ new customers |
| Formula | The actual calculation | (Meta + Google Ads spend) ÷ Shopify new customers |
| Source | Where the data lives | GA4, Shopify |
| Owner | Who’s accountable | Head of Growth |
| Cadence | Update frequency | Weekly |
| Notes | Edge cases | Exclude influencer barter orders |
A marketing dashboard aggregates key performance indicators, enabling marketers to monitor progress and adjust strategies efficiently. But without a spec, those KPIs are just noise dressed as insight.
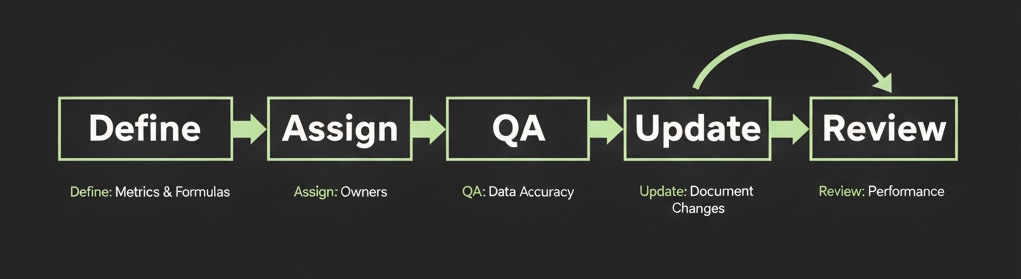
How to Implement the Spec
Step 1: Audit What You’ve Got
List every dashboard in circulation. Flag duplicates and contradictions. Identify metrics without clear ownership or definition.
Step 2: Define and Approve Metrics
Start with 10. That’s enough to find most of your alignment problems. Bring finance, marketing, and ops together for a 60-minute metric alignment session. Lock the final KPI definitions into your dashboard spec.
At one DTC brand I worked with, we found five different versions of “CAC” across reports. Fixing it took a single meeting and shaved hours off their weekly reporting cycle.
Step 3: Assign Ownership
One metric, one owner. Ownership isn’t about control—it’s about clarity. Document the owner’s name, department, and how often they’re expected to review data quality.
Step 4: QA and Change Management
Create a checklist for every refresh:
- Does the dashboard match the spec?
- Are formulas unchanged?
- Are anomalies explained?
When definitions change, document who approved them and why. These are data governance performance metrics, and they’re what separate living dashboards from digital junk drawers.
Keeping Dashboards Honest
Cadence
Weekly: metric owners verify data.
Monthly: team reviews cross-functionally.
Quarterly: full audit before the board deck goes out.
Escalation Rules
Conflicting numbers? The spec wins.
Formula updates? Require approval from the metric owner and a data steward.
Reporting Hygiene
Keep dashboards lean—no more than 15 metrics per view. Highlight changes, not vanity totals. Annotate exceptions.
The best dashboards give teams visibility into what’s working and what’s not by consolidating data across channels and campaigns. Yours should do the same—quietly, consistently, without argument.
Why This Work Matters
Dashboards aren’t about dashboards. They’re about trust.
Executives don’t fund teams that can’t agree on numbers. Marketing doesn’t win budget by showing pretty charts—it wins by showing reliable ones. A dashboard spec isn’t paperwork; it’s political armor. It proves your numbers survive scrutiny.
Another read: GA4 Content Grouping Setup: Structuring Analytics for the Media-to-Cart Loop
Key Takeaways
- Dashboards fail because definitions fail.
- Every metric needs a formula, source, owner, and update schedule.
- The dashboard spec turns data chaos into shared language.
- Governance builds trust faster than visuals do.
- Download the template and fix your dashboards before your next Monday meeting.
FAQ
A dashboard visualizes data. The spec defines it. The first is presentation; the second is governance.
Quarterly minimum. High-volume metrics (like CAC or ROAS) should be checked weekly.
Revenue, CAC, LTV, Retention, Exceptions, Conversion Rate, and Email Revenue Share—metrics that tie directly to growth, not just reach.
Agree on definitions first, then automate the math. The spec is your peace treaty.
Bake QA into job expectations. Ownership without accountability is just decoration.
Closing the Loop
Next Monday, when that revenue slide comes up, you’ll see one number.
Not two.
Not a debate.
Just truth—written, agreed, and owned.
That’s what a good dashboard does: it doesn’t make you argue louder. It makes you argue less.