
Attribution Analytics
Marketing Dashboard Metrics: How to Build Executive-Proof Dashboards
Most dashboards fail in exec meetings. Learn how operators define metrics, assign ownership, and maintain QA so leaders can trust the numbers.
The digital media stack for 2026 is not about hacks or viral luck. It is a process-driven system that captures ideas once, repurposes them across formats, and converts with owned channels tied to commerce. Includes a worked example, deliverability checklist, a minimal CAC/LTV model, and a 90-day rollout plan.

You are publishing into a market that punishes wasted effort. Global ad spend climbed to roughly $1.17 trillion in 20251, and social platforms took a growing share of that money. Discovery costs more. Competition gets louder. Free reach breaks faster.
Digital video now captures about 58% to 60% of all TV and video ad budgets2. If your team cannot produce video, cut it into derivatives, and route that attention into owned channels, you are buying more volatility every quarter.
Email still carries the best margin in the stack, but mailbox providers tightened the rules. Gmail and Yahoo now require authentication and one-click unsubscribe for bulk senders, and Gmail exposes spam-rate thresholds inside Postmaster Tools3. If list hygiene slips, unit economics slip with it.
Thesis: The 2026 digital media stack is a margin system. It captures an idea once, atomizes it across formats, converts rented attention into owned audience, and measures success in subscriber economics instead of views.
Most teams still run content like a publishing calendar. That model breaks when reach gets expensive. Operators need a harder rule: every asset must either lower acquisition cost, raise subscriber value, or lift conversion downstream.
That changes what counts as a “good” media program:
If one layer breaks, the stack stops compounding. A strong reel with no capture path wastes attention. A good lead magnet with poor deliverability wastes list growth. A large list with weak conversion flow inflates vanity metrics and hides weak economics.
Before you pick tools or templates, define the number that governs the stack. For most operator-led media programs, that number is allowable subscriber acquisition cost.
| Input | Value |
|---|---|
| Average order value | $68 |
| Gross margin | 70% = $47.60 gross profit |
| 90-day subscriber-to-sale | 3.5% |
| Value per subscriber, 90-day | 47.60 × 0.035 = $1.67 |
| Allowed blended subscriber acquisition cost | At or below $1.67 |
| Payback window | 90 days |
Use this table to set the boundary. If your organic system costs more than the value it creates, fix conversion or cut production cost. If paid top-ups exceed the cap, you are scaling an unprofitable media engine.
Keep that rule in view for the rest of the article. Capture controls production cost. Distribution controls acquisition efficiency. Deliverability protects the value of every subscriber you already paid to acquire.
| Function | Primary job | Example tools |
|---|---|---|
| Planning | Turn ideas into governed production work | Notion, Airtable, Asana |
| Creation | Produce one core asset and derivative formats fast | Canva, Descript, Figma, Adobe CC |
| Distribution | Push discovery into owned destinations | WordPress, Ghost, Substack |
| Commerce and lifecycle | Convert captured attention into orders and repeat revenue | Shopify-class ecommerce, Klaviyo-class email service provider (ESP) |
| Analytics | Tie output, capture, and sales back to economics | Google Analytics 4 (GA4), Fathom, Looker Studio |
Read the stack in order: capture, atomize, distribute, convert, protect deliverability, then measure. That sequence matters because each step protects the economics of the next one.
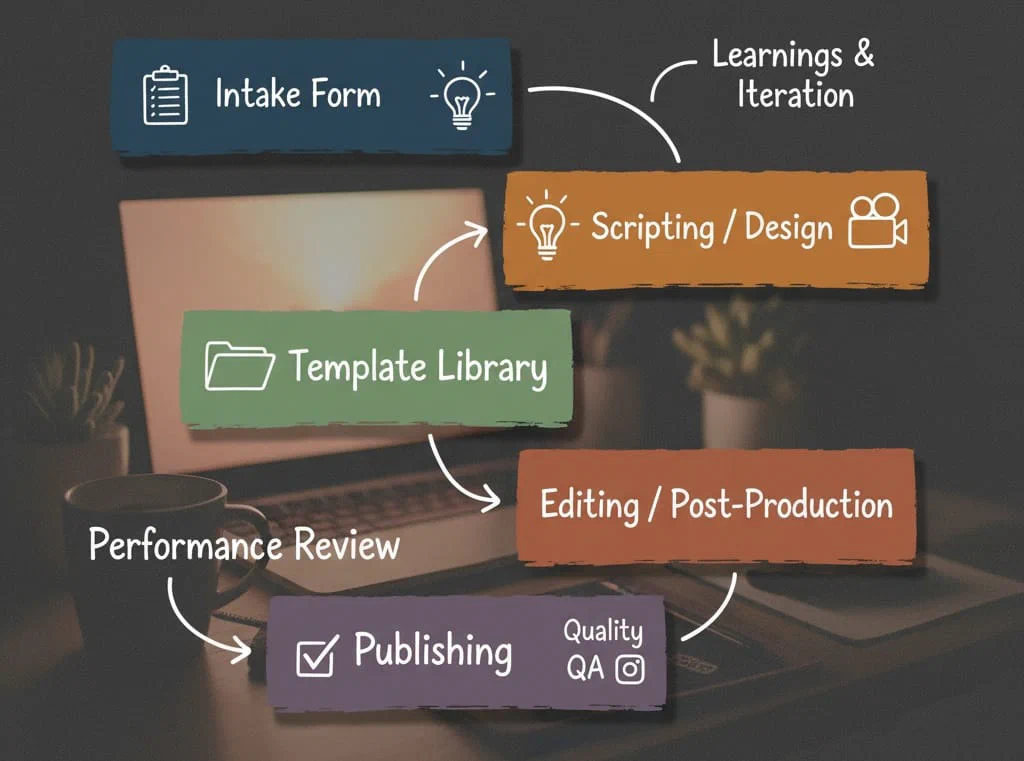
Treat ideas as reusable operating assets, not one-off campaigns. A usable stack starts with briefs, scripts, b-roll, headline banks, call to action (CTA) snippets, and review checkpoints that can move across channels without reinvention.
If intake is loose, every downstream metric gets worse. The team misses ship dates, revises assets that should have been approved upstream, and pays production cost twice for the same idea.
Minimum viable workflow
Tools that actually help
Plan in Notion, Airtable, or Asana. Build in Canva, Descript, Figma, or Adobe CC. Keep templates in a shared library. Use AI for first drafts, clipping, resizing, captions, and alt text. Keep a human pass on claims, tone, and compliance.
What good looks like
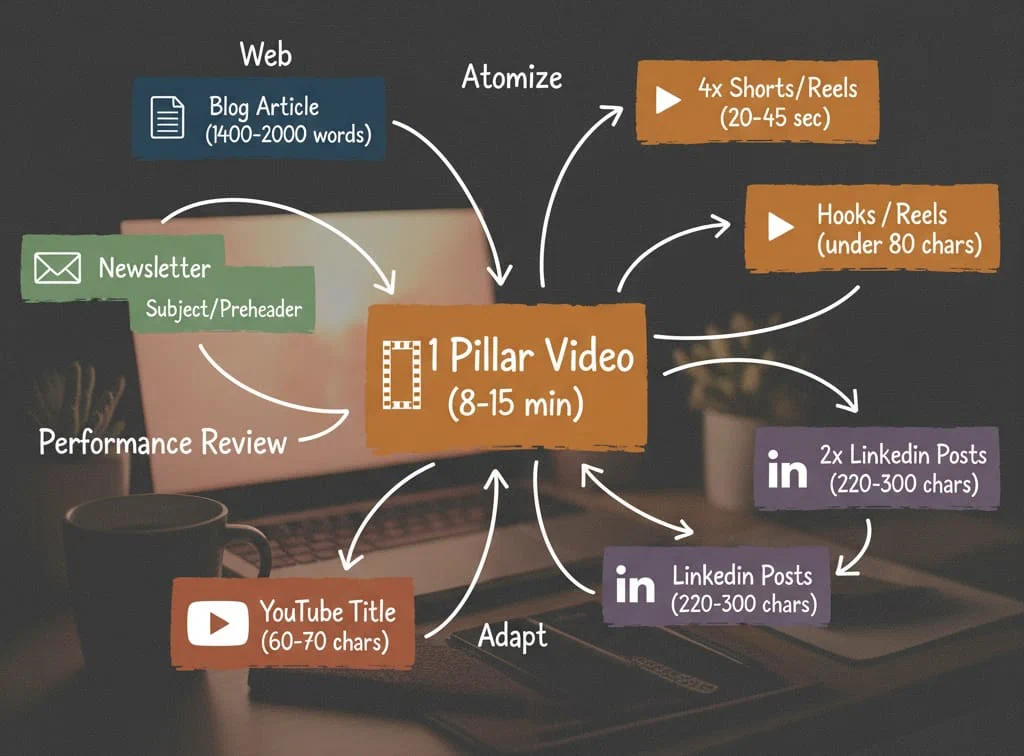
Once you trust intake, the next job is output efficiency. One pillar should fund the week. If your team needs a new idea for every channel, you are paying too much for production and learning too slowly from what works.
Use this as a baseline:
Guardrails
What good looks like
More output only helps when it reaches a destination you control. Social discovery still matters. It just does not deserve to sit at the economic center of the stack. Your site and your list do.
Use social to earn attention. Use owned destinations to capture it. Every distribution choice should answer one question: where does this attention go next?
CMS decision triggers
| Choose this | If you need | Why |
|---|---|---|
| Substack | Under 2 hours to launch and built-in network discovery | Fast validation, weaker customization at scale |
| Ghost | Membership revenue, clean performance, and data ownership | Lean media operations with low platform drag |
| WordPress | Advanced SEO, complex layouts, ecommerce, and deep integrations | Best fit when content must connect tightly to commerce |
Choose the CMS that fits the end state, not the one that feels easiest this week. Migration costs surface later as broken templates, weak analytics, and wasted production effort.
This is also where measurement architecture starts. If your content lives in a system that cannot segment performance by business function, you will struggle to see which assets feed revenue. GA4 Content Grouping Setup: Structuring Analytics for the Media-to-Cart Loop covers that reporting layer in detail.
What good looks like
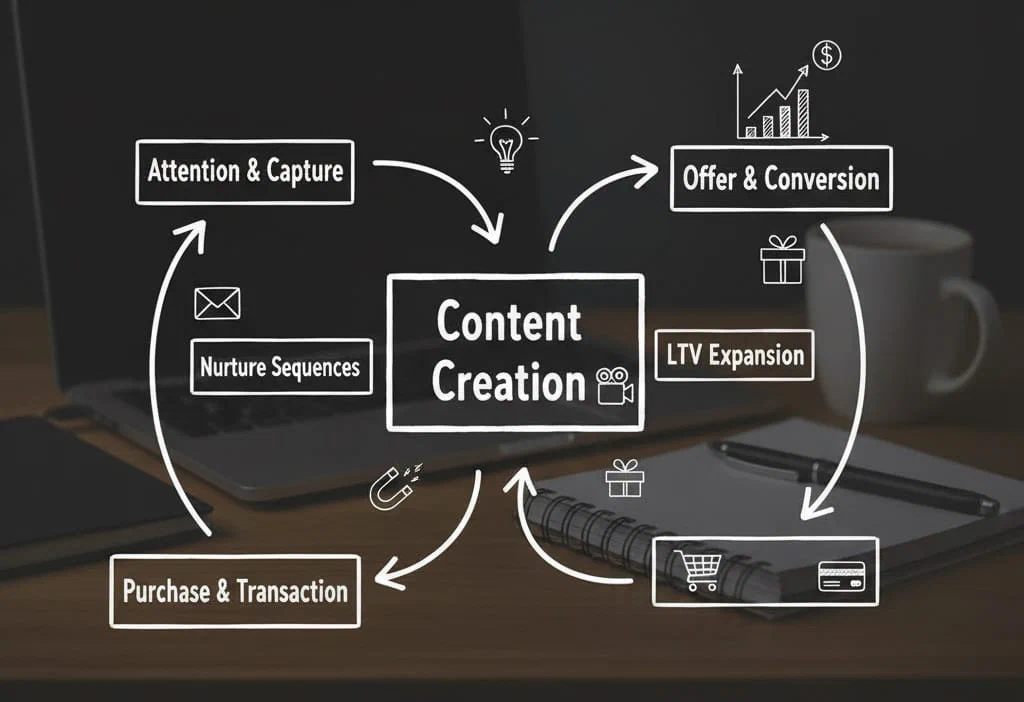
Owned traffic becomes valuable when you can move it into a revenue path. Every asset needs a next step that fits the reader’s level of intent.
Five-email sequence
Digital video absorbs a majority share of TV and video budgets4. That only helps you when the video drives email capture, product views, and measurable buying intent.
The same rule applies to on-site reporting. If your dashboard only counts clicks and sessions, it will miss whether content actually moved people toward purchase. Marketing Dashboard Metrics: How to Build Executive-Proof Dashboards is the right next layer once this stack is live.
What good looks like
Conversion depends on reach you still control after the click. Owned audience is only an asset when you can reach it. That makes deliverability part of the conversion system, not a separate technical chore.
Configure
Send
Hygiene
Targets
Ignore this layer and the rest of the stack gets more expensive. You paid to earn the subscriber. Deliverability determines whether you keep earning from them. For the deeper operating sequence, use The Email Deliverability Runbook.
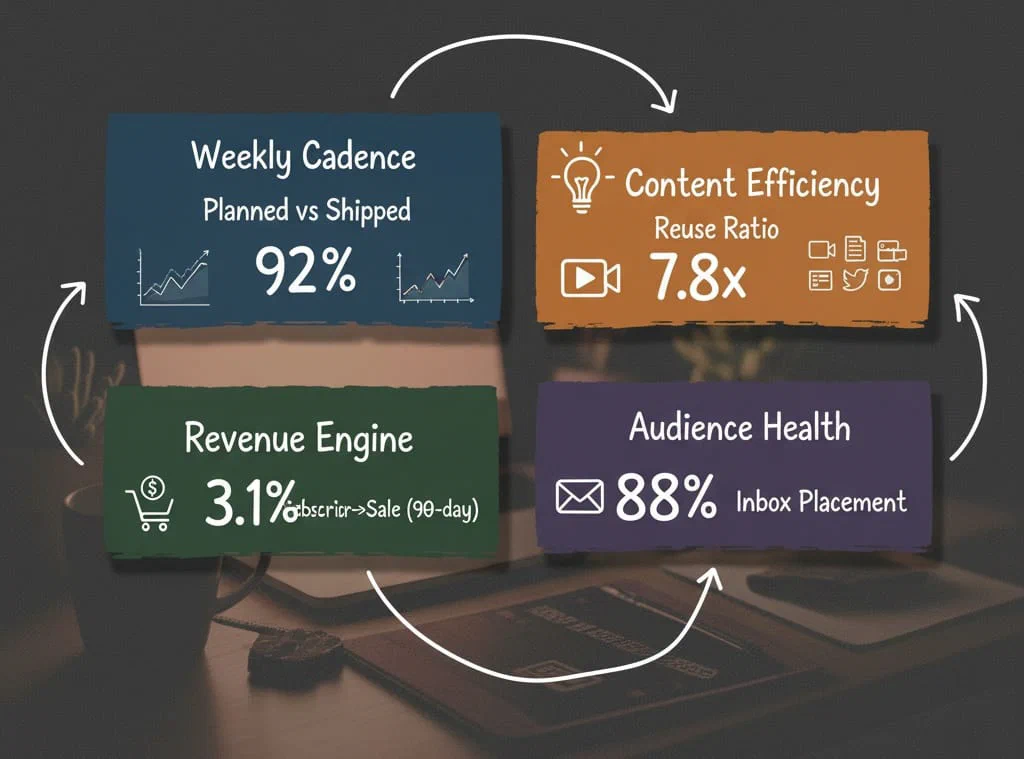
A healthy stack gives you two types of visibility: process visibility and revenue visibility. You need both.
If your dashboard reports output without economics, it will tell you what shipped but not whether the system deserves more capital. If attribution still overstates performance after the dashboard is in place, use Attribution Triage for Operators: Make Marketing Data Useful Without Breaking Your P&L to reconcile the reporting layer before you scale spend.
The simplest way to judge the model is to run it through one operating case.
Context
Inputs per week
Outputs per week
One blog article, one YouTube long-form video, four Shorts or Reels, two LinkedIn posts, and one newsletter
Baseline, weeks 1 to 2
The stack is losing money at the subscriber level.
Interventions, weeks 3 to 8
After 60 days
This is the point of the stack. Publish less often if you have to. But improve the value of every subscriber while holding production cost inside a profitable range. Digital video budgets reward that shift when you tie video to capture and revenue outcomes.9
Methodology note
Numbers reflect a mid-ticket DTC brand with North America traffic. Deliverability benchmarks come from Validity, video budget share from IAB, and sender requirements from Gmail’s bulk-sender documentation and Postmaster Tools guidance. Actuals will vary by niche and offer.10
Weeks 1 to 2: foundation
Authenticate email, set up one-click unsubscribe, warm any new domain, finalize templates, define cadence, and ship one pillar per week.11
Weeks 3 to 6: execution
Atomize each pillar into 6 to 10 assets. Launch the five-email sequence. Add product blocks and related items to articles. Turn on a quiz or lead magnet.
Weeks 7 to 9: instrumentation
Publish the dashboard. Track planned vs. shipped, reuse ratio, subscriber-to-sale, and inbox placement. Prune inactive segments. This is the point where your dashboard specification and GA4 content grouping work should already be in place.
Weeks 10 to 12: scale
Test two offers. Add paid boosts only where blended subscriber acquisition cost stays at or below the allowed cap. Reinvest where subscriber-to-sale improves.
The teams that win in 2026 will not win because they posted more. They will win because they built a system that turns discovery into owned audience, owned audience into conversion, and conversion data into better capital allocation.
Remember one rule: do not judge the stack by views. Judge it by whether it lowers acquisition cost, protects deliverability, and increases subscriber value over a 90-day window.
https://www.mediaweek.com.au/global-ad-market-forecast-upgraded-as-social-media-spend-surges/ ↩︎
https://www.iab.com/wp-content/uploads/2025/07/2025_IAB_Digital_Video_Ad_Spend_Full_Report_July_2025.pdf ↩︎
https://www.iab.com/wp-content/uploads/2025/07/2025_IAB_Digital_Video_Ad_Spend_Full_Report_July_2025.pdf ↩︎
https://www.twilio.com/en-us/blog/insights/google-new-spam-page ↩︎
https://www.validity.com/wp-content/uploads/2025/03/2025-Benchmark-Report-FINAL.pdf ↩︎
https://www.validity.com/wp-content/uploads/2025/03/2025-Benchmark-Report-FINAL.pdf ↩︎
https://www.emarketer.com/content/digital-video-ad-spend-thrives-despite-advertising-headwinds ↩︎
https://www.validity.com/wp-content/uploads/2025/03/2025-Benchmark-Report-FINAL.pdf ↩︎

Frequently Asked Questions
It is the operating system for a creator-led company: planning, creation, distribution, commerce, and analytics stitched into a repeatable pipeline. Use AI where it speeds throughput and keep humans in the loop for quality.
Yes. Paid accelerates testing and reach, but economics depend on your owned system. Use the CAC and LTV table to set hard limits. Video budgets follow outcomes.
Automate handoffs, clipping, templating, captions, and first drafts. Keep human review for tone and claims. That mix delivers speed without brand drift.
Move when you need deeper customization, stronger analytics, or tight ecommerce integration. Substack is a fast testbed. Ghost and WordPress are foundations for operating and scaling.
Continue Reading