
Analytics Setup
GA4 Content Grouping Setup: Structuring Analytics for the Media-to-Cart Loop
How to configure GA4 content grouping to segment analytics by business function rather than URL structure.
Stop chasing perfect attribution. This operator-first explainer shows how to align GA4, Shopify, Klaviyo, and TripleWhale with MER, handle subscription renewals, reconcile overlapping claims, and ship margin-true reporting with a 10-minute checklist.

Finance reports $100,000 in revenue. Meta claims $80,000, Klaviyo claims $40,000, GA4 claims $85,000. Total business revenue is still $100,000. Nothing is broken. This is the predictable consequence of different methodologies, attribution windows, and platform incentives.1
This is an attribution triage guide for ecommerce operators. If budget decisions, promo calendars, and inventory risk sit on your desk, the instinct to chase attribution agreement is wrong and expensive. Platform numbers will never reconcile perfectly. The discipline is treating attribution as directional signal — a diagnostic layer on top of financial reality. Your P&L is financial truth. Attribution tells you where to look.
Operators who hold that distinction make tighter budget decisions and protect margin. Those who lack it spend their time reconciling conflicting dashboards, and they still make the wrong call—because they evaluate platform totals instead of running a reconciliation workflow anchored to actual revenue.
What follows: a default settings guide across the four main platforms, a four-step reconciliation loop, a worked example with real numbers and real financial consequences, and a ten-minute monthly checklist.
Marketing Efficiency Ratio (MER) is total revenue divided by total marketing spend. No channel segmentation, no attribution windows — just dollars in versus dollars out at the portfolio level. MER is the only marketing metric that cannot be inflated by a platform reporting its own results.
Use MER as the primary guardrail for budget pacing. When MER holds, you can investigate channel-level attribution discrepancies methodically. When MER drops, evaluate strategy before spending time on pixel issues.
Consider a typical month: MER holds at 3.2x while platform-attributed revenue fluctuates ±25% week over week. The attribution volatility is noise — shifting windows, a creative rotation that changed the last-touch mix, a broadcast email that pulled forward subscription orders. MER doesn’t move because total spend and total revenue didn’t move. That signal tells you the business is stable. The attribution swings are a story about measurement methodology, not performance.
Once MER is established as your anchor, use channel attribution for a narrower purpose: diagnosing creative fatigue, evaluating audience segments, identifying which touchpoints are influencing new customer acquisition. MER answers “should I spend more or less?” Attribution answers “where should I look next?”
Consider a diagnostic vignette: A DTC brand sees its Meta-reported ROAS drop from 3x to 1.5x over a weekend due to a pixel outage. Across the same weekend, portfolio MER holds perfectly steady at 4x. Because the operator relies on MER as the P&L anchor, they view the pixel outage as a reporting failure, not a performance failure. They maintain the spend, revenue stays flat, and they avoid a reactionary budget cut that would have genuinely hurt acquisition.
If MER is strong and attribution is volatile, the problem is measurement — not your media mix. Do not change budgets based on attribution instability alone. Fix the measurement methodology first, then assess.2
Every ad platform exists to justify its cost. Meta uses view-through credit and a customizable lookback window. Google Ads defaults to data-driven attribution, which redistributes credit across touchpoints in ways that consistently favor Google’s own inventory. GA4’s reporting attribution model is separate from its data collection model and can be changed retroactively. Numbers will not match across tools. This is structural, not a bug.34
Double attribution is the norm. Klaviyo and Meta will both claim the same order. Your platform-total sum will exceed 100% of actual revenue because each system is solving for its own reporting logic, not your P&L.5
The financial cost of ignoring this is specific:
Subscription revenue introduces a second layer of distortion on top of platform bias.
Klaviyo default behavior. Klaviyo attributes on last touch within a window that includes both email opens and clicks. On renewal cycles, attributing an open to a broadcast campaign for an order that was going to execute regardless inflates email-attributed revenue significantly. Switch to click-only attribution. For subscription SKUs with predictable renewal cadences, shorten the attribution window further.6
Note: changing Klaviyo attribution settings reprocesses historical data. Prior period numbers will restate. Document the change date in your governance log before switching, and treat the before and after as separate measurement regimes.7
Recharge renewals. Recharge fires renewal orders automatically without user interaction. By default, GA4 and ad platforms will see these as standard conversion events and credit them to whatever paid touchpoint last fired before the renewal. Three steps to correct this:
subscription_renewal) so they can be filtered independently in Shopify Reports and GA4 via Looker Studio.Why this matters for your numbers. Blending new orders with renewals in any performance view artificially suppresses your CAC and artificially inflates your LTV. A business running 40% subscription revenue that does not separate these streams is operating on a mirage. Your next purchase order, your next media plan, and your CAC targets will all be calibrated to a metric that doesn’t reflect acquisition economics.
Maintain a dedicated renewal dashboard. Track renewal revenue, churn rate, and renewal-attributed spend separately from acquisition metrics at all times.
See also: GA4 Content Grouping Setup: Structuring Analytics for the Media-to-Cart Loop
Before running the reconciliation loop, configure your platforms to minimize structural noise. These settings do not eliminate discrepancy — they reduce the sources of false signal so that remaining variance is investigable.
| Platform | Setting | Default | Change To | Why |
|---|---|---|---|---|
| GA4 | Reporting attribution | Data-Driven in many properties | Last non-direct click for reconciliation runs; Data-Driven for creative trend analysis | Easier alignment to Shopify when you need financial reality; DDA for insight |
| GA4 | Conversion lookback | Often 90 days | 30 days for most ecommerce cycles | Reduces stale credit that muddies current decisions |
| Meta Ads | Attribution window | 7-day click, 1-day view | Keep 7dC/1dV for standardization | Baseline for cross-platform comparisons |
| Google Ads | Model/window | Varies; many accounts now DDA | Temporarily use last-click or reconcile in GA4 with last non-direct click; align click window with Meta where possible | Improves cross-platform comparability during reconciliation |
| Klaviyo | Email attribution | Last-touch with open and click windows (e.g., 5 days) | Click-only; shorter window for subscription products | Stops ghost credit on renewals, mitigates MPP open inflation |
| Shopify | UTMs and source tracking | Varies by team | Enforce a strict UTM schema and landing page tagging | Keeps checkout source usable in reconciliation |
| Subscriptions | Revenue segmentation | Often mixed | Separate new vs renewal across all dashboards | Prevents CAC and LTV distortion |
A note on Klaviyo open attribution: Apple’s Mail Privacy Protection pre-loads email tracking pixels, creating phantom opens that never correspond to a human reading the email. Open-inclusive attribution has been unreliable since iOS 15. If you are still using open windows in Klaviyo attribution, you are crediting sends that no one read. Switch to click-only and recalibrate your email-attributed revenue expectations downward before making any channel mix decisions based on the current numbers.
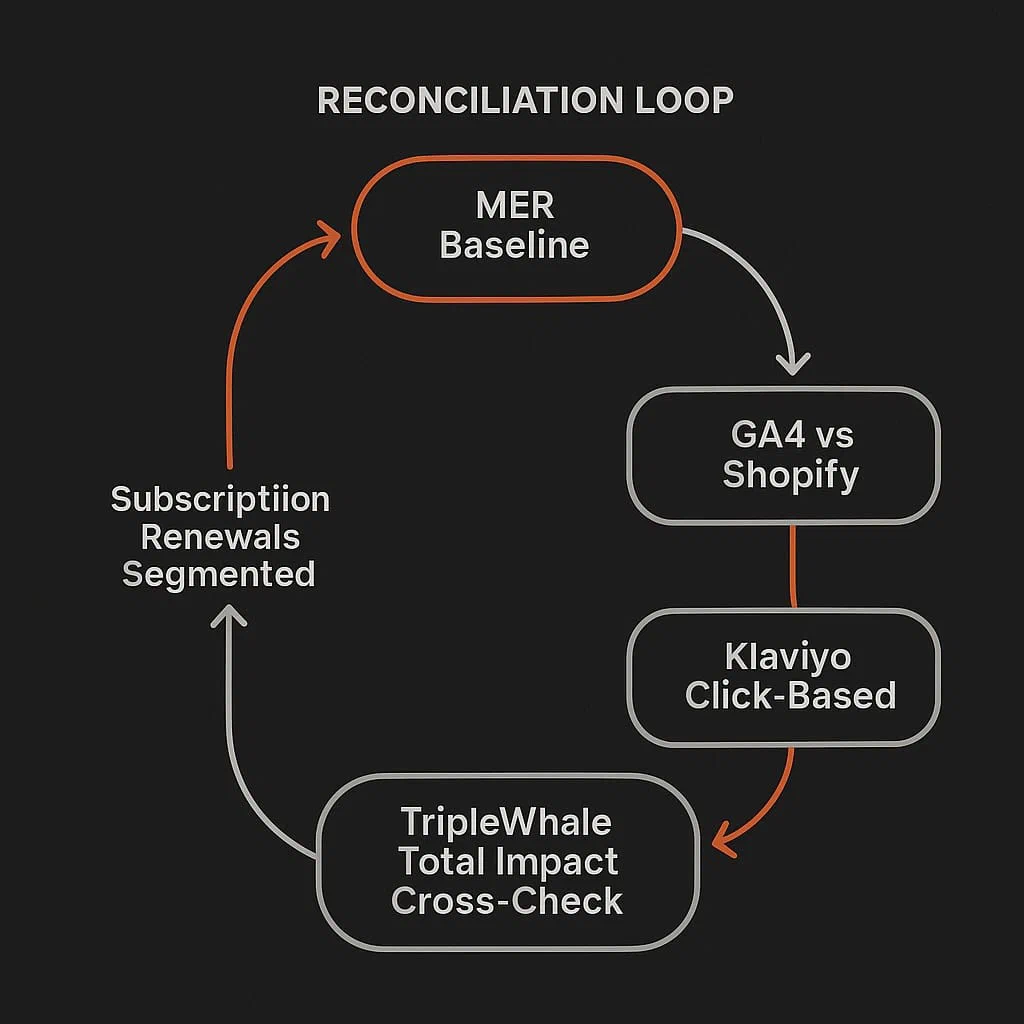
With settings configured, run this loop at the close of every month and after any major promotion.
Step 1: Establish the MER baseline.
Pull total revenue from Shopify and total marketing spend from your media plan — not from platforms, which can double-count spend against shared audiences. If MER is materially off target, stop here. A channel reconciliation exercise will not fix a strategy problem. Investigate spend efficiency, promotional depth, or product mix before moving to channel-level analysis.
Step 2: Reconcile GA4 against Shopify.
Expect a gap. Common sources: time zone differences between Shopify and GA4, cookie drop and blocked tracking, GA4’s modeled conversion filling for unobserved data, cancellations and partial refunds that Shopify records but GA4 doesn’t, and sessionization methodology differences. A gap of 5–10% is standard operating variance for most stores.10
Determine your store’s specific tolerance using a full calendar quarter of historical data, then use that baseline — not the industry guideline — as your investigation threshold. If the gap exceeds your threshold, work through the root-cause list before adjusting any channel budgets. A large GA4-to-Shopify gap usually points to a tracking implementation issue, not a channel performance issue.
Step 3: Layer in Klaviyo data.
Compare click-based attribution to open-inclusive. Click-based will be lower — often materially lower since iOS 15 for any brand with significant Apple Mail users. Click-based attribution better reflects the actual decision point: someone engaged with enough intent to click. Use click-only Klaviyo data for all planning and margin analysis. Use open-inclusive data only to understand send volume and list health trends.
Step 4: Resolve overlap with the GA4 tie-breaker.
When Meta and Google both claim the remaining revenue, use GA4’s last non-direct click as the arbiter. Maintain a separate Data-Driven view for creative analysis, but use last non-direct click strictly for financial reconciliation. This prevents channels from double-counting the same bottom-of-funnel conversion.
Step 5: Cross-check with your multi-touch attribution tool.
If you use TripleWhale, run the Total Impact model. It adjusts for overcredit on upper-funnel channels, including brand search — which Google Ads systematically overclaims because branded queries are high-intent and cheap, producing inflated ROAS.11
If you do not use TripleWhale or a comparable MTA tool, apply this logic manually. Pull branded search spend and revenue separately. Compute its attributed ROAS against Shopify-verified revenue rather than GA4. Finally, treat brand search as a holding cost rather than an acquisition driver in your scaling model.
When Total Impact and platform dashboards diverge significantly, the typical cause is either overlap (two channels claiming the same order) or a window mismatch (one channel using a longer lookback than your standard). Resolve the overlap before drawing conclusions about channel efficiency.
Scenario: A 7-day sitewide promotion with paid support. Forty percent of revenue comes from subscribers.
Raw platform reports
| Source | Reported Revenue |
|---|---|
| Shopify | $100,000 |
| GA4 | $86,000 |
| Meta Ads | $55,000 |
| Google Ads | $18,000 |
| Klaviyo (open-inclusive) | $42,000 |
| Klaviyo (click-only) | $28,000 |
| TripleWhale Total Impact | $94,000 |
Total paid spend: $28,000 (Meta + Google combined).
Platform-reported sum across paid and email: Meta + Google + Klaviyo open-inclusive = $115,000 against $100,000 in Shopify revenue.
Adjustments
Segment renewals. Pull renewal transaction IDs from Recharge. Of Klaviyo’s $42,000 open-inclusive, $18,000 traces to renewal orders that would have executed regardless of the broadcast send. Remove them from paid and email attribution and move to the renewal dashboard.
Remove overlap. Identify orders claimed by both Meta and Klaviyo. Where there is no Klaviyo click in-window, remove the email credit. This removes approximately $8,500 in duplicate attribution across the two channels.
Apply the tie-breaker. For remaining channel conflicts, use GA4 last non-direct click as the arbiter. Maintain a separate Data-Driven view for creative analysis; use last non-direct click only for financial reconciliation.
Post-reconciliation
Channel-attributed total settles at $98,500 against Shopify’s $100,000 — a 1.5% variance, within tolerance.
The budget decision without reconciliation:
Total platform claims of $115,000 on $28,000 in paid spend produce an apparent blended efficiency of 4.1x. At a scaling threshold of 3.5x, this reading supports a budget increase. A 20% increase — from $28,000 to $33,600 — looks defensible from the dashboard.
The budget decision with reconciliation:
The $16,500 gap between platform claims and reconciled reality consists of renewal orders credited to paid channels and duplicate attribution between Meta and Klaviyo. Neither represents incremental revenue driven by the campaign. After removing both, the actual efficiency of paid spend against new-order revenue is 3.5x — exactly at the threshold, not above it. The correct call is to hold spend and investigate, not scale.
Specifically: click-only Klaviyo data was already signaling declining CTR on the promotional emails. That is a creative fatigue signal. Scaling into a creative that is losing engagement, while the underlying paid ROAS is at — not above — your threshold, compresses gross margin. The incremental $5,600 deployed at a diminishing return — against a pool artificially inflated by renewals — fails to cover its own cost. This traces the source of the 1.5-point gross margin squeeze: not overspend in isolation, but overspend at the wrong moment in the creative cycle, triggered by a false-positive efficiency signal.
See also: Marketing Dashboard Metrics: How to Build Executive-Proof Dashboards
Run this monthly. It takes ten minutes.
CTA: Download the Attribution Sanity Checklist.
https://help.shopify.com/en/manual/reports-and-analytics/discrepancies ↩︎
https://www.triplewhale.com/blog/marketing-efficiency-ratio ↩︎
https://business.facebook.com/business/help/460276478298895/ ↩︎
https://searchengineland.com/marketing-attribution-models-the-pros-and-cons-451733 ↩︎
https://help.klaviyo.com/hc/en-us/articles/11118357030555 ↩︎
https://support.getrecharge.com/hc/en-us/articles/9828306941207-Recharge-metrics-and-Klaviyo-flows ↩︎
https://developers.google.com/analytics/devguides/collection/ga4/ecommerce ↩︎
https://kb.triplewhale.com/en/articles/7128379-the-total-impact-attribution-model ↩︎

Frequently Asked Questions
Use GA4 last non-direct click for reconciliation views and Data-Driven for creative insights. The model follows the decision, not the other way around.
Segment renewals. Do not credit them to paid or broadcast email without a click in-window. Keep Klaviyo in click-only mode and maintain a separate renewal dashboard.
Different windows, view-through credit, and incentives. Expect overlap and remove it. Do not total platform claims and compare the sum to Shopify.
Guideline: ~5–10% is common for many stores. Larger gaps deserve investigation before you change budgets or forecasts.
Continue Reading